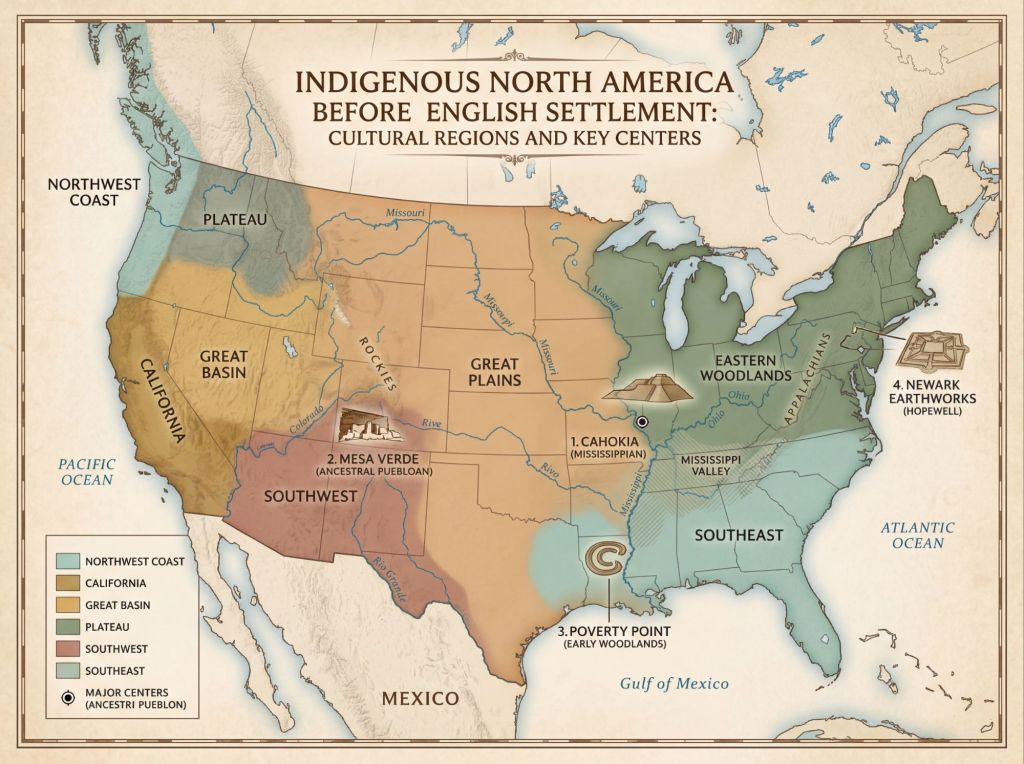
Map 1 — Indigenous North America Before English Settlement
This map introduces the earliest era in U.S. history by showing North America as an already inhabited, organized, and interconnected world long before English colonization. Rather than presenting the land as empty space, it highlights broad Indigenous cultural regions shaped by geography, climate, river systems, and long-established human movement. The marked centers—Poverty Point in Louisiana, Cahokia near present-day St. Louis, Chaco Canyon in New Mexico, and the Effigy Mounds region in the Upper Mississippi Valley—demonstrate that Indigenous societies created major ceremonial, political, and trade centers over many centuries. The rivers, especially the Mississippi system, are important because they supported settlement, agriculture, exchange, and communication across great distances. The trade-route arrows reinforce the idea that distant communities were connected through networks of movement and cultural contact. This map therefore sets the foundation for the whole series: the history of the future United States begins not with Jamestown, but with thousands of years of Indigenous presence, adaptation, and achievement. It also reminds readers that these regions were not rigid modern borders, but living cultural landscapes shaped by migration, exchange, and environmental knowledge. (Summarized.)
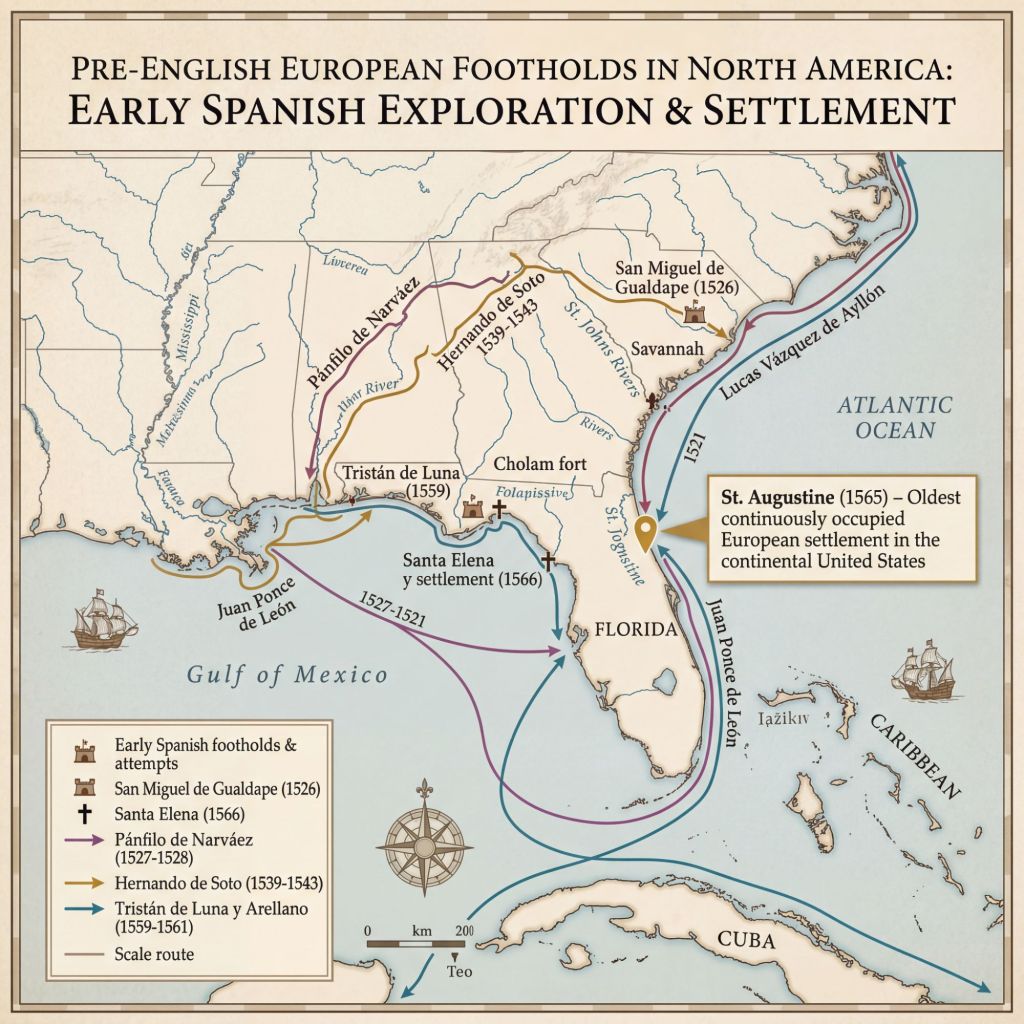
Map 2 — St. Augustine and the Pre-English European Footholds
This map explains the phase of North American history that came before permanent English colonization, focusing on the Spanish presence in Florida and the wider Southeast. Its central point is that the earliest lasting European footholds in what is now the United States were not English, but Spanish. The main marker, St. Augustine, is especially important because it was founded in 1565 and is recognized by the National Park Service as the oldest continuously occupied European settlement in the continental United States. By placing St. Augustine at the center, the map highlights how Spain secured strategic coastal positions decades before Jamestown. The exploration and maritime routes show why Florida mattered: it stood at the crossroads of Atlantic navigation, imperial defense, and access to the Caribbean and Gulf. The mission zones and fortified sites suggest that early colonization depended not only on settlement, but also on religion, military protection, and sea-based supply networks. Just as importantly, the map keeps Indigenous regions visible, reminding the reader that this was already an inhabited and contested world. European arrival did not create history here; it entered an older landscape shaped by Native peoples, regional exchange, and political complexity. (Source- National Park Service, Llambias House, FL)
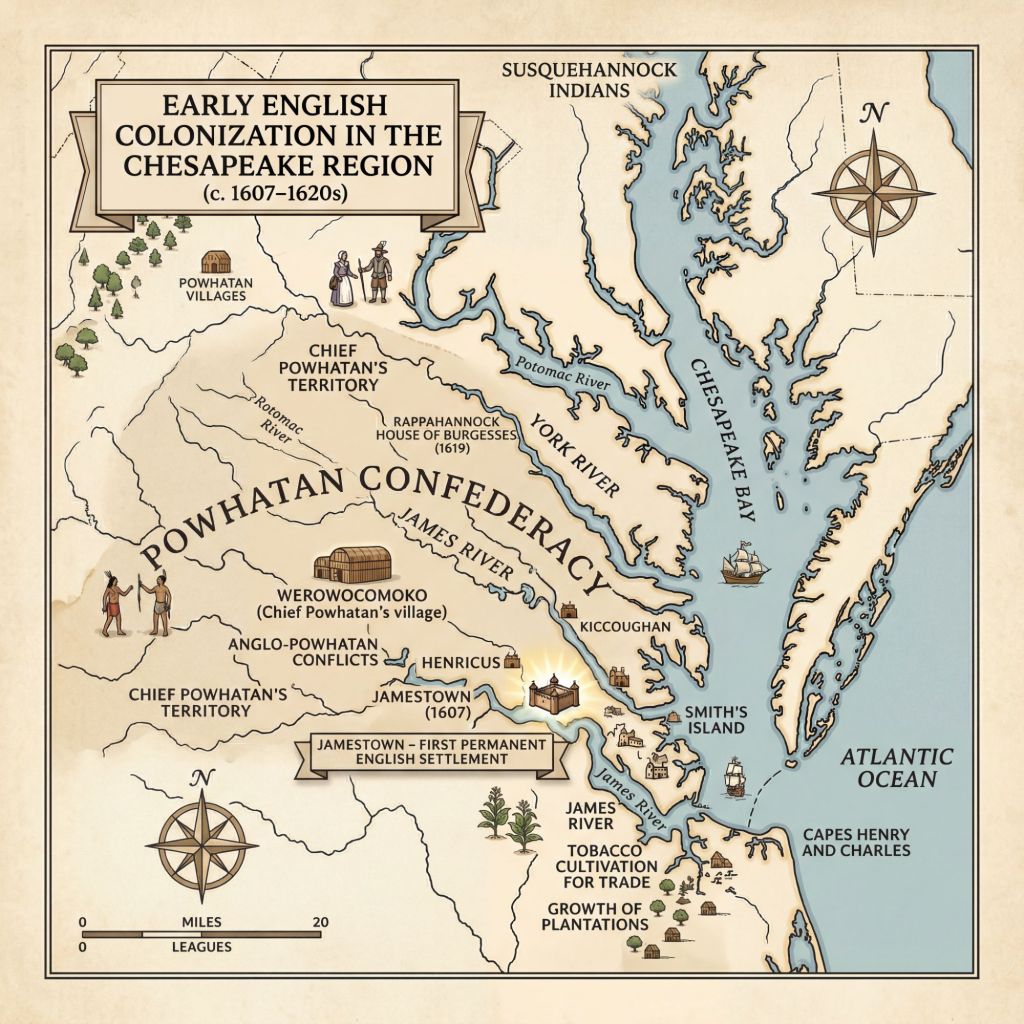
Map 3 — Early English Colonization in the Chesapeake
This map traces the beginnings of permanent English settlement in the Chesapeake, focusing on Jamestown, the James River, and the wider lands of the Powhatan Chiefdom. Founded in 1607, Jamestown became the first permanent English settlement in North America, but the map makes clear that it emerged within an already occupied Indigenous landscape. The shaded Powhatan region shows that English Virginia developed through contact, negotiation, exchange, and conflict with Native peoples rather than in isolation. Waterways dominate the composition because the Chesapeake Bay and the James River were the colony’s lifelines, linking settlements to Atlantic shipping, supply, and communication. The tobacco zones explain how Virginia changed from a fragile outpost into a profitable colony, since tobacco cultivation pushed settlers outward along riverbanks and increased demand for land and labor. The two 1619 markers identify a major turning point in colonial history: the beginning of representative assembly in English Virginia and the arrival of the first documented Africans in the colony. Together, these features show how early Virginia combined commerce, political development, and territorial expansion while deepening conflicts over Indigenous lands. In this way, the map presents the Chesapeake as the birthplace of enduring patterns in English America. (Summarized – National Park Service).
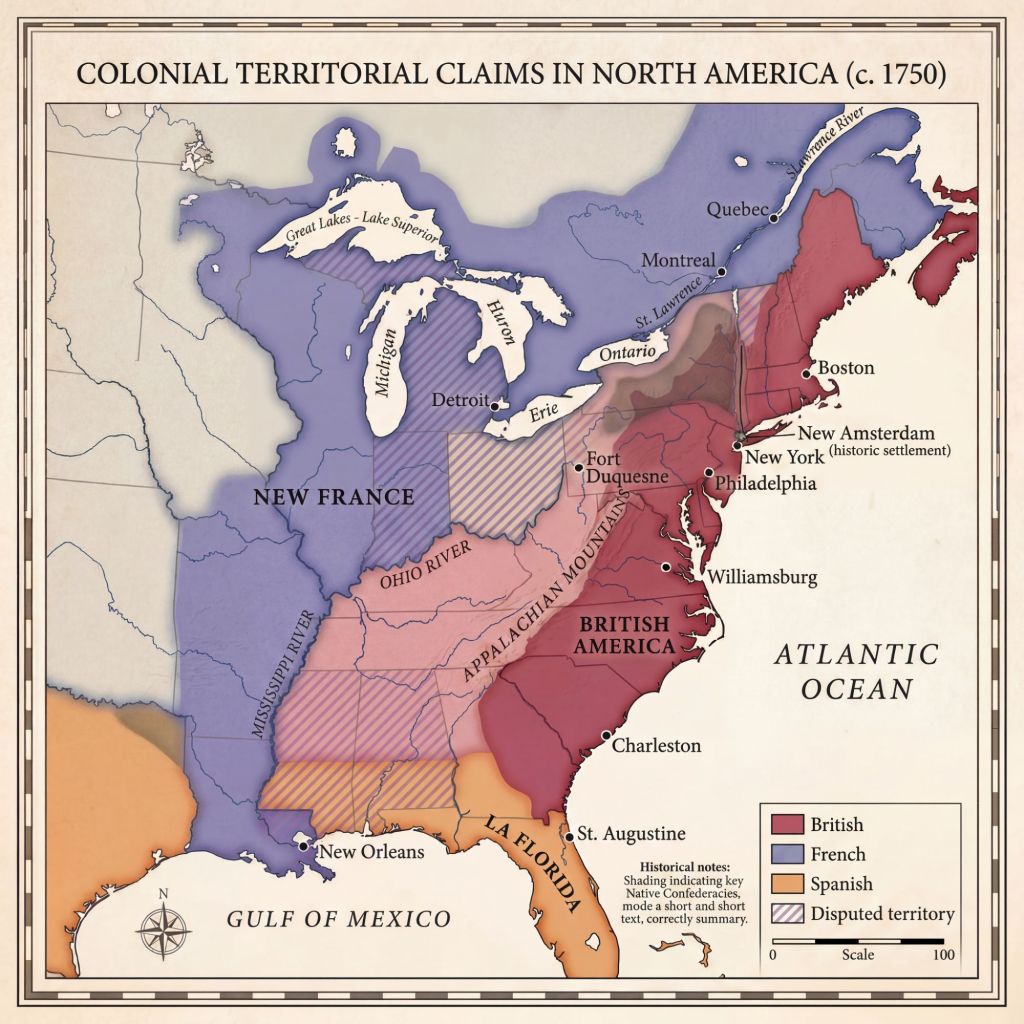
Map 4 — Competing Empires in North America
This map shows eastern North America as a contested region shaped by several rival powers. Britain held the Atlantic colonies, Spain controlled Florida, the Dutch built New Netherland around New Amsterdam, and New France, marked in purple, stretched through the St. Lawrence, Great Lakes, and interior river systems. The map also keeps Native confederacies visible, showing that Indigenous nations were major political, military, and diplomatic forces. New Amsterdam, founded in 1624, became a key Dutch trading center, and Dutch influence continued in New York even after the English takeover in 1664. Frontier areas remained uncertain because imperial borders were often overlapping, disputed, and weakly enforced inland. This map therefore explains that English control did not appear all at once. It developed slowly through trade, alliance, settlement, and conflict in a continent already shared by Native peoples and competing European empires. (National Park Service, The Rise and Fall of New Netherland)
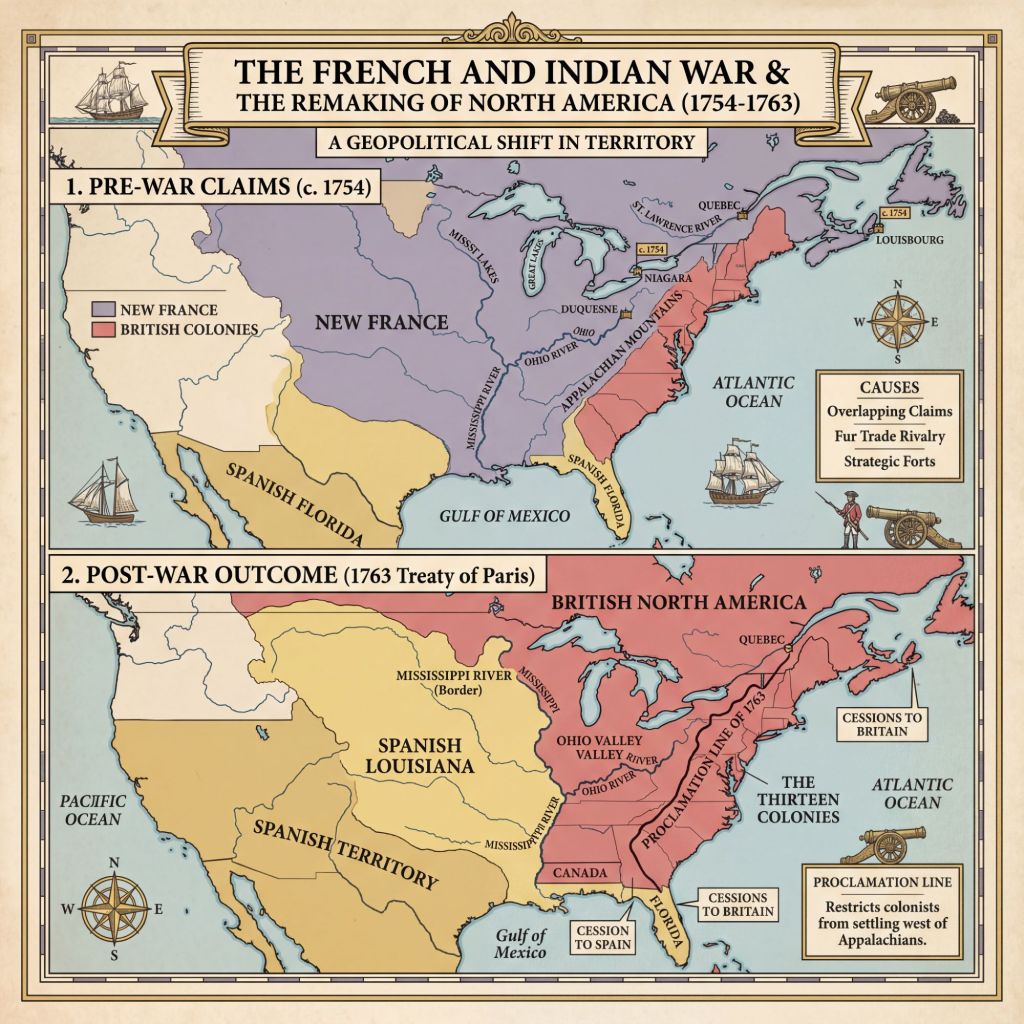
Map 5 — The French and Indian (Native Americans) War
This map explains the French and Indian War as the imperial struggle that reshaped North America between 1754 and 1763. The main focus is the Ohio Valley, where British and French claims overlapped and frontier tensions turned into open war. The map contrasts the British colonies on the Atlantic seaboard with New France across the interior and highlights the importance of forts, rivers, and mountain barriers. It also shows the territorial changes confirmed by the Treaty of Paris in 1763, when Britain gained lands east of the Mississippi and took Spanish Florida. Although Britain emerged victorious, the war created problems. Defending the frontier and paying war debts led the British government to tighten control over its colonies. New taxes, western restrictions, and imperial policies increased resentment in British America. For that reason, this map is not about conflict; it also shows the turning point that led to the American Revolution. (Summarized: history.state.gov, French and Indian War/Seven Years’ War, 1754–63)
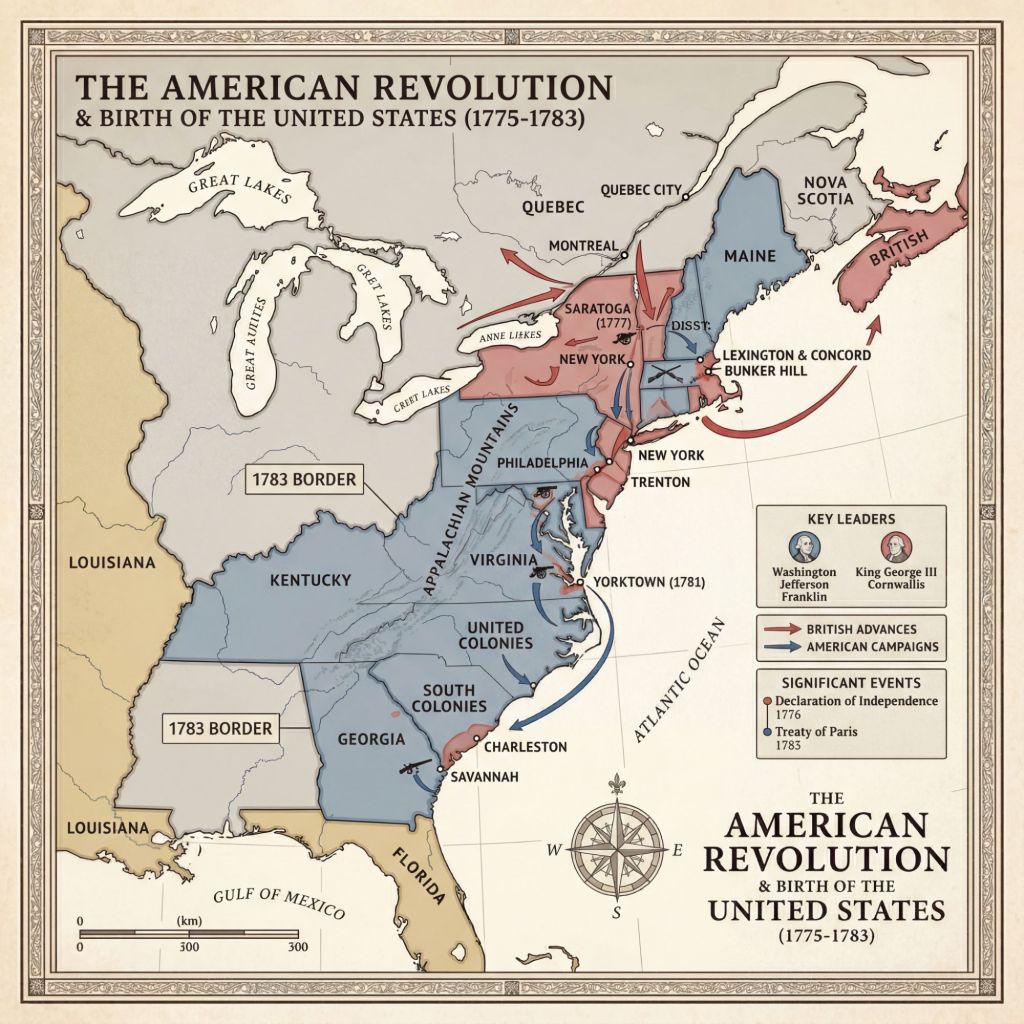
Map 6 – The American Revolution
This map shows how the American Revolution turned thirteen British colonies into the United States. Fighting began in 1775, and independence was declared in 1776. The map highlights campaign routes, battle sites, and Yorktown, where British resistance collapsed. It also marks the 1783 boundary established by the Treaty of Paris, which formally recognized American independence and the borders of the new nation. France appears as an important ally because foreign support helped the colonies defeat Britain. Overall, the map presents the Revolution as both a military struggle and a political transformation that created the United States as an independent republic. (1776–1783: Diplomacy and the American Revolution, history.state.gov)
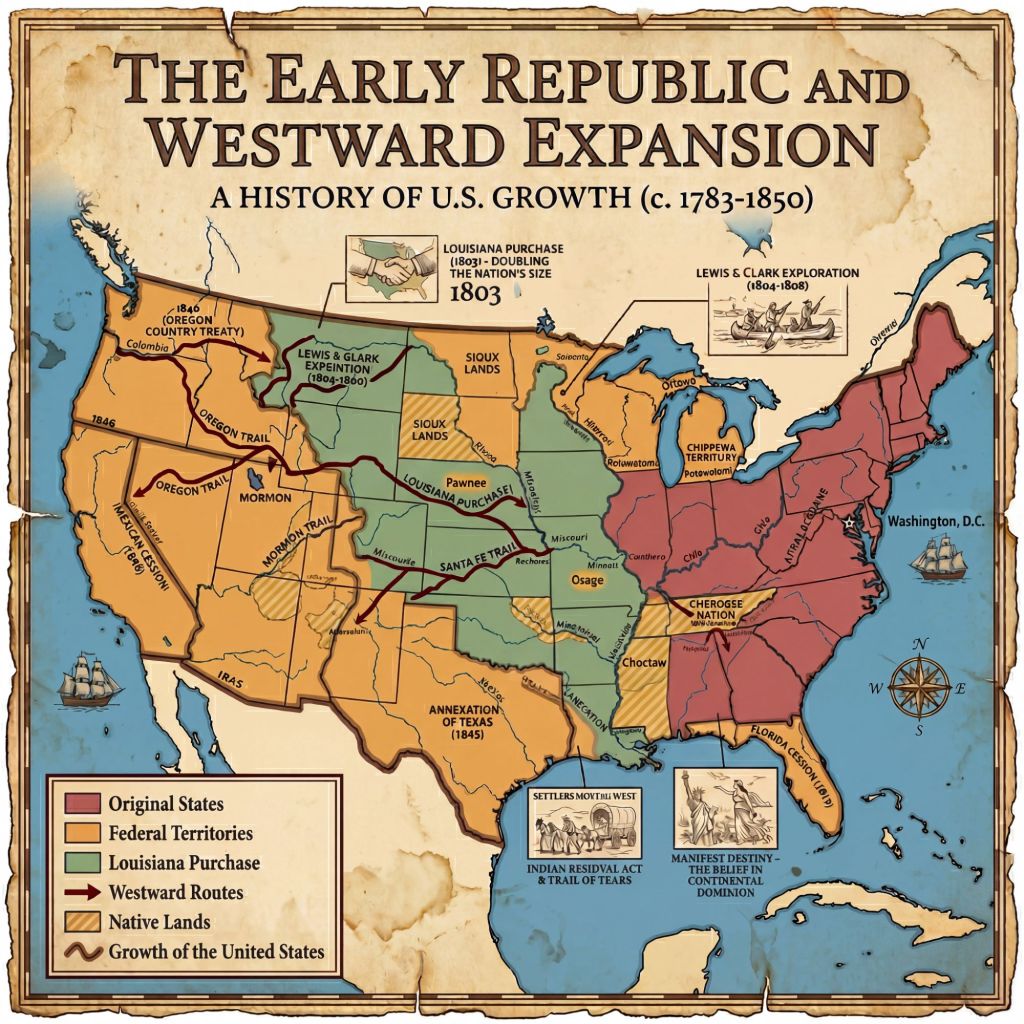
Map 7- The Early Republic and Westward Expansion
This map shows how the United States expanded after independence and became a much larger nation between 1783 and 1850. The original states appear on the Atlantic side, while new federal territories show how the national government organized land beyond the first states. The Louisiana Purchase, marked in green, is the most important change because it doubled the size of the country in 1803. Rivers such as the Mississippi and Missouri helped connect these lands and guided movement westward. The arrows show routes used by settlers as they moved into new areas. Native lands are also included to remind readers that westward expansion placed heavy pressure on Indigenous peoples and increased conflict. The map also suggests why this period mattered politically: growth brought new questions about slavery, territory, and power. Overall, it presents the early republic as a nation building itself through expansion, migration, and federal planning for the future. (archives.gov/milestone-documents/list)
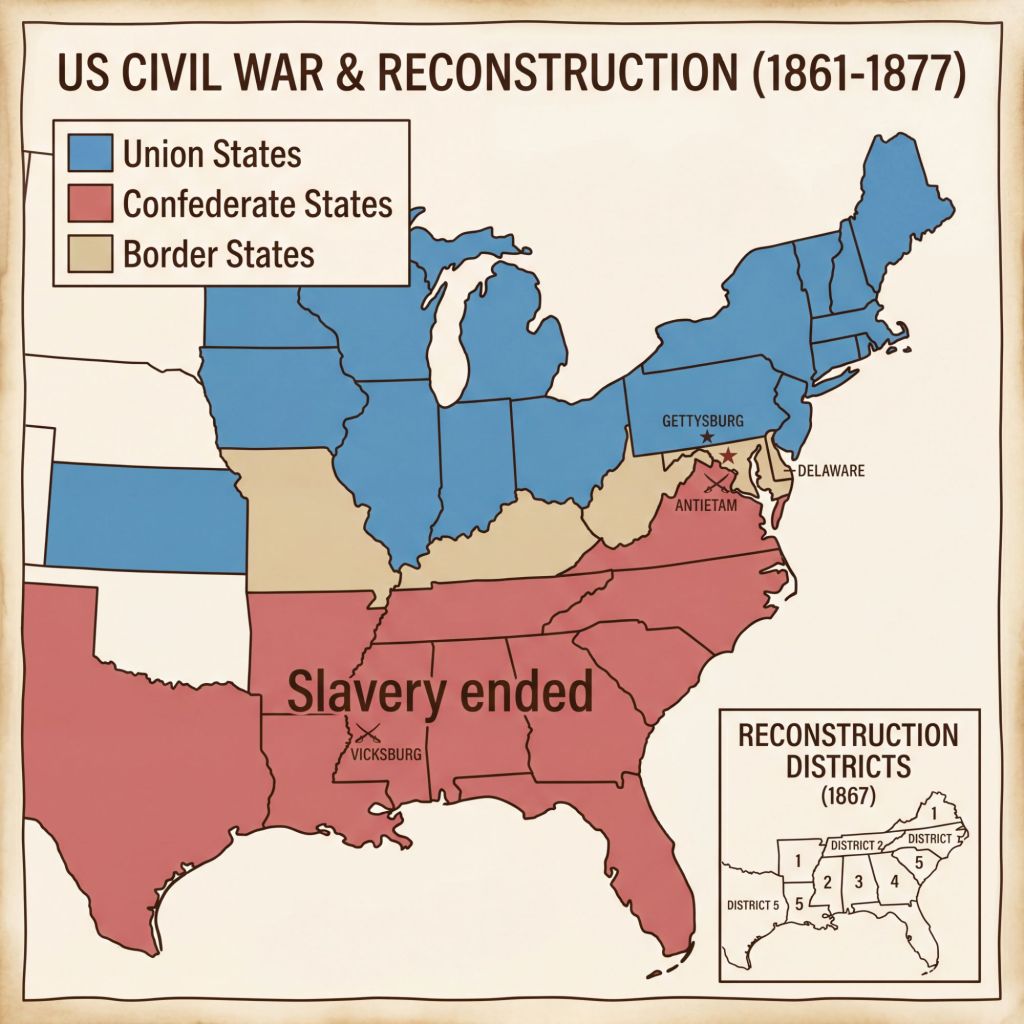
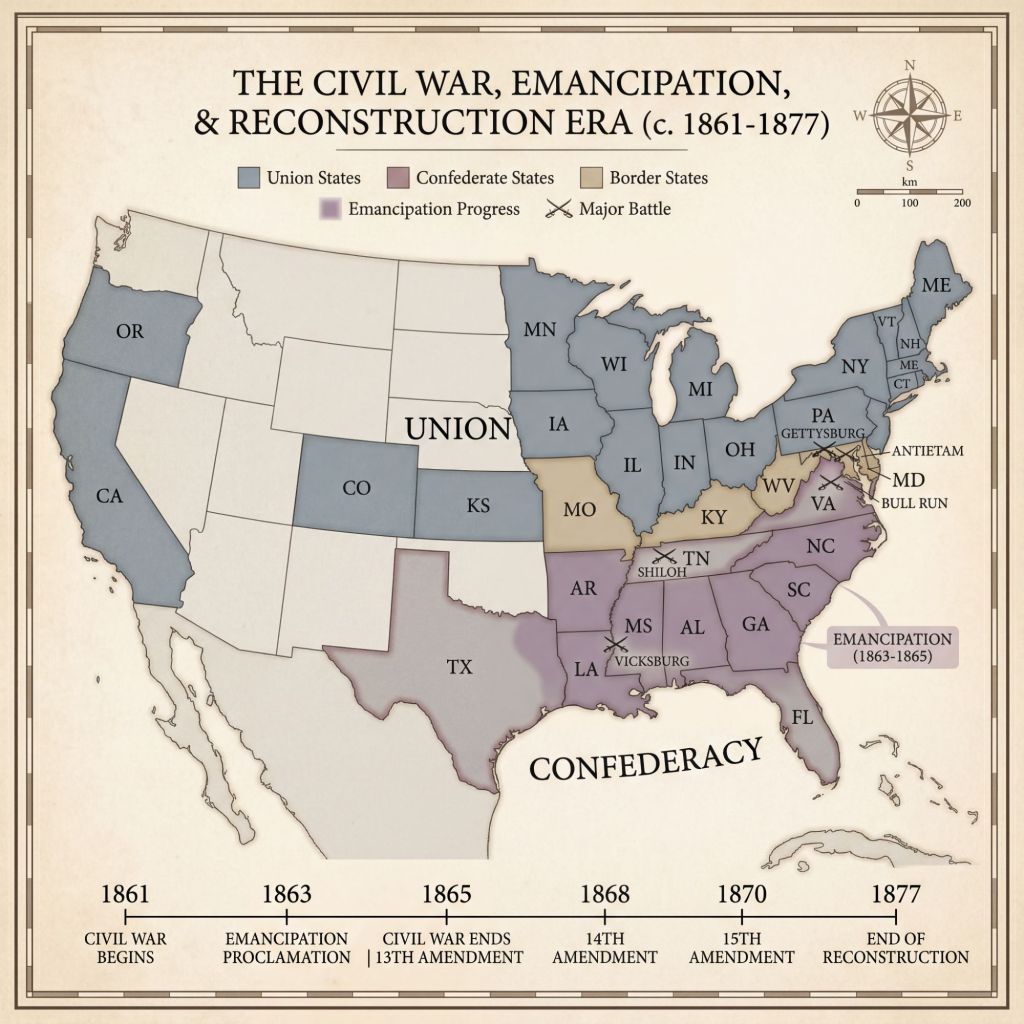
Map 8 (2 maps)- The Civil War and Reconstruction
This map (the one above) shows how the United States was divided during the Civil War and what happened after the war. The blue states are the Union, which stayed with the United States. The red states are the Confederacy, which left the Union. The tan states are the border states, which stayed in the Union but were close to the South. The small battle symbols mark important fighting areas. The label “Slavery ended” shows the major change that came from the war. The inset map of Reconstruction Districts shows how the South was reorganized after 1865 under federal control. This era was important because the Union was restored, slavery was abolished, and rights were redefined after the war.
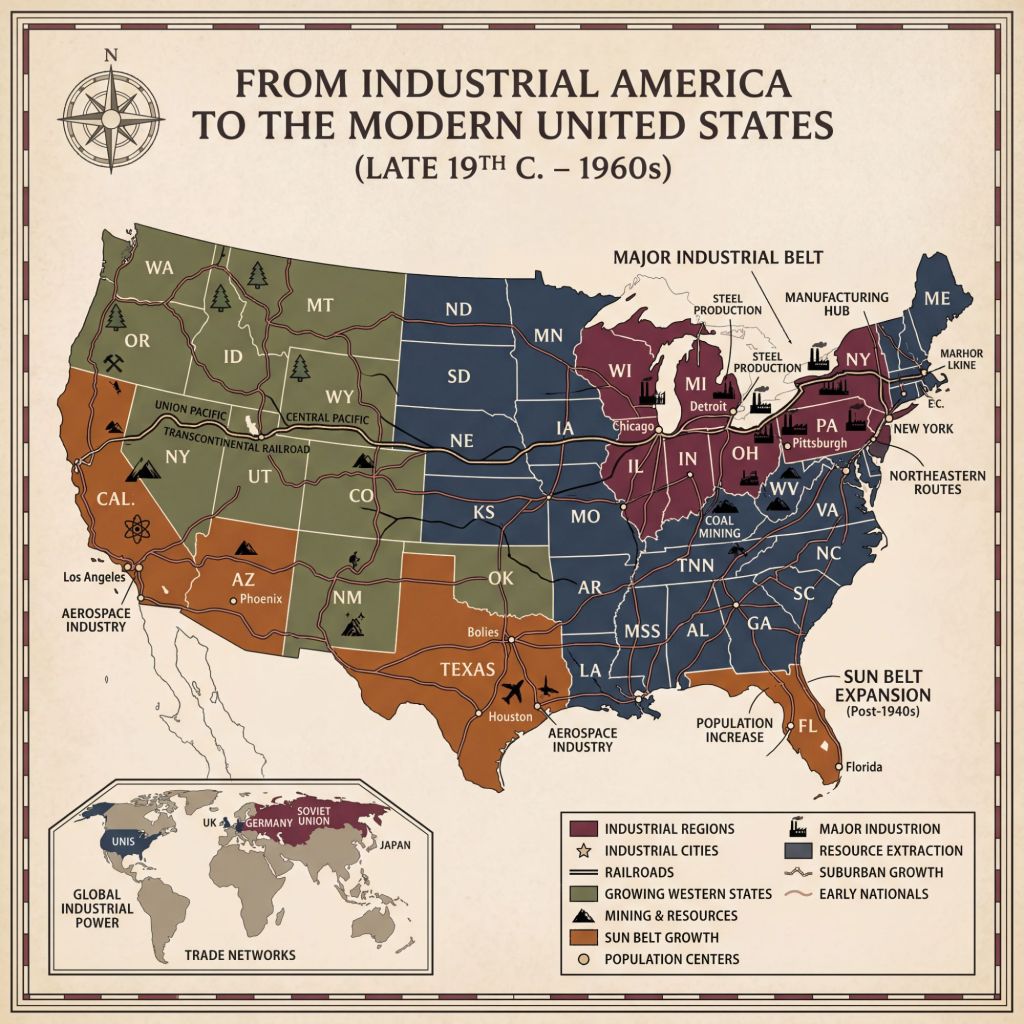
Map 9 – From Industrial America to the Modern USA
Map 9 brings the story into the modern age. It shows how industry, railroads, cities, global influence, and the civil rights movement helped turn the United States into a modern power. In conclusion, this map represents the country’s transformation from a growing industrial nation into a leading world state and a changing democracy.
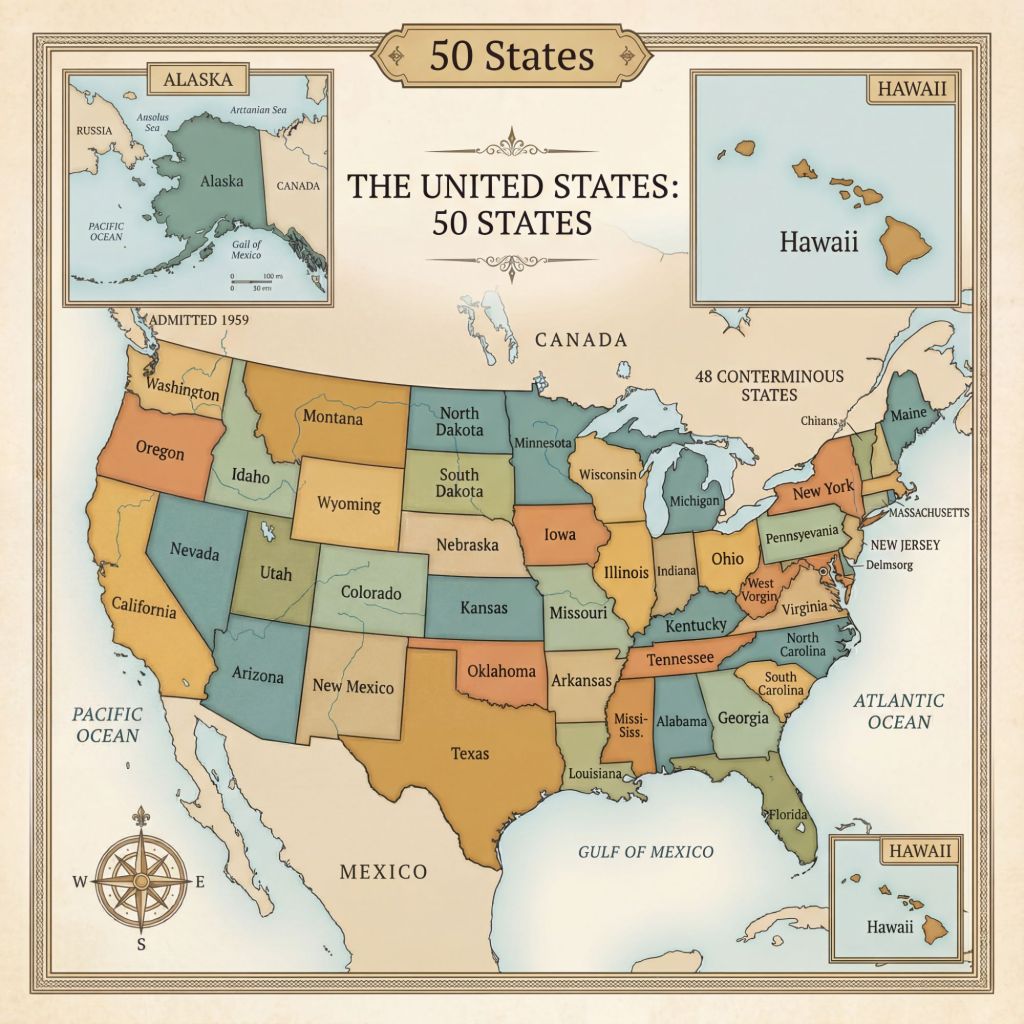
Map 10 — Final form of the country
Map 10 completes the series by showing the United States in its present national form: a 50-state union including Alaska and Hawaii. It is the final territorial picture of the country as people know it today. Alaska was added by purchase from Russia in 1867, and Hawaii was annexed in 1898 and became the 50th state in 1959. Alaska became the 49th state in 1959, and Hawaii became the 50th the same year.
